Submillimeter-Wave Astronomy Sattellite (SWAS)
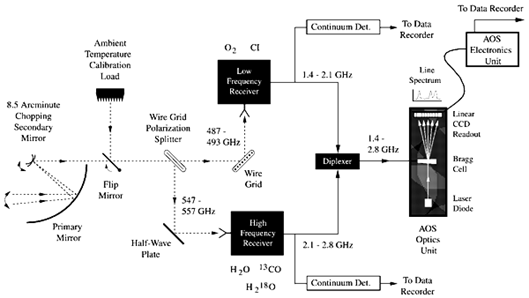
Figure: Block Diagram of the SWAS System.
The Submillimeter-Wave Astronomy Satellite (SWAS) was launched in December of 1998 as a part of NASA's Small Explorer Project (SMEX) and can serve as an example for the characteristics of astronomical systems in the Submillimeter Terahertz spectral region [1]. SWAS was designed to study the Holy Grail of interstellar astrophysics, star formation from dense clouds. It does this by specific observation of water, molecular oxygen, atomic carbon, and isotopic carbon monoxide, species that are central to the cooling processes in these clouds that are necessary for gravitational collapse. To accomplish its goals, SWAS operates in the 487 - 556 GHz spectral region, a region in which observations cannot be made from the ground because of atmospheric attenuation, primarily due to the strong 110 - 101 transition of water itself.
A block diagram is shown in Figure: Block Diagram of the SWAS System . After the photons are collected by a 68 x 53 cm aluminum primary mirror and provision is made for comparison with a calibration load, the power is split with a wire grid polarizer into two channels and sent to separate heterodyne detectors. Because the background against which the molecular emissions are viewed is in general very cold (often that of the cosmic microwave background at 2.7K), it is advantageous to use the gain in sensitivity that can be obtained with cooled mixers. However, in order to reduce size and cost and increase the mission lifetime, in SWAS they are only passively cooled to ~170 K rather than to cryogenic temperatures.
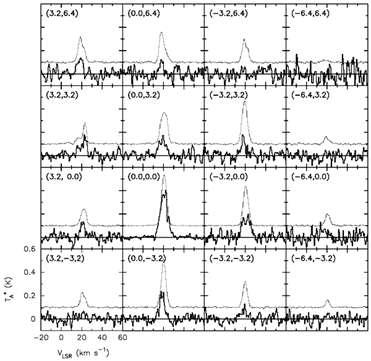
Figure: CO and H2O Transition. Spectra of the
110-101 tran-
sition of H2O (thick lines) and the J=5-4 transition of 13CO (thin
lines) obtained in the astronomical source M17SW. The 13CO sp-
ectra are divided by 10 in all cases except at positions (0.0, 0.0)
and (-3.2, 0.0), where the spectra are divided by 20. The 16 sp-
ectra make up a 4x4 map obtained on a rectangular grid separ-
ated by 3.2.
Thus, the receiver consists of two (one for each polarization) second harmonic mixer diodes, each pumped by its own frequency tripled InP Gunn oscillator. The first of these systems is centered near 490 GHz to observe O2 and atomic carbon and the second near 555 GHz for the study of 13CO and H2O. To further conserve precious photons, multiplex operation is achieved by the use of an acousto-optical spectrometer which allows the simultaneous observation of 700 1 MHz channels between 1.4 and 2.1 GHz. Figure: CO and H2O Transition shows the result of a SWAS study of the prototypical giant molecular cloud core M17SW [2]. From these spectra the distribution in space, abundance (calculated from integrated line intensity), and velocity profiles (calculated from Doppler shifts) of both species are obtained. Each location in the figure represents typically 3 - 7 hours of integration time to observe these weak signals that are only a few tenths of a degree above the 2.7 K microwave background. Another interesting feature of these results is that the local oscillator and IF frequencies are selected so that the H2O and 13CO can be observed simultaneously by use of the response in each sideband of the heterodyne receiver. Finally, it should be noted how much stronger the isotopic 13CO line is that of H2O. In fact, CO is so abundant in the interstellar medium that its less abundant isotopic species are often used for astrophysical studies to avoid the problems associated with recovering remote sensing data from optically thick data. The 13CO spectra are divided by 10 in all cases except at positions (0.0, 0.0) and (-3.2, 0.0), where the spectra are divided by 20. The 16 spectra make up a 4 x 4 map obtained on a regular grid separated by 3.'2.