Image of a Complex Object: OSU Physics Building Atrium
The gamma density function of Eq. 1 was first used to analyze the speckle at three areas of the
unmodulated image of the Physics atrium shown in the upper panel of
Figure: Physics Building Atrium GHz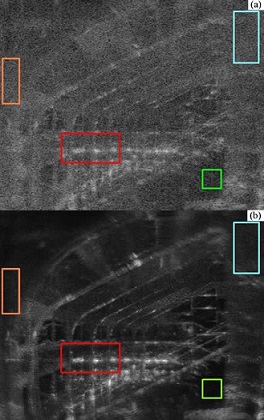
Image. (a)218.4 GHz image of the atrium
of the Physics Building at Ohio State Univer-
sity with multimode illumination, but without
modulated mode-mixing and (b)with modul-
ated mode mixing. The colored boxes show
areas for which speckle statistics have been
calculated.
However, as we have noted above, the images of the physics atrium are complex, not only because of the
angular variation that forms the image, but also in the nature and variety of its reflection. For a
surface that has a surface roughness that is less than a wavelength, the resulting reflection will be
part specular and part diffuse. The resulting signal will not create the "fully developed speckle"
pattern of Eq. 1, but will follow a modified Rician density function
\begin{equation}p_I(I)=\frac{1}{I_n}e^{-\left(\frac{I}{I_n}+\gamma\right)}I_0\left(2\sqrt{\frac{I}{I_n}r}\right)\end{equation}
where $I$ is the intensity, $I_n$ is the average speckle intensity, $r$ is the ratio of the specular
reflection amplitude to the average speckle intensity, and $I_0$ is the modified Bessel function of
order zero. The contrast of the image is \begin{equation}C=\frac{\sqrt{1+2r}}{1+r}\end{equation} The
same intensity distributions as above were fit to modified Rician density functions after normalizing to
the average speckle intensity, shown in
Figure: Rician Function Fit. Fits to the Rician fun-
ction of Eq. 24 for the image within the (a) orange,
(b) green, and (c) blue boxes of the upper panel in
Figure: Physics Building Atrium GHz Image
.
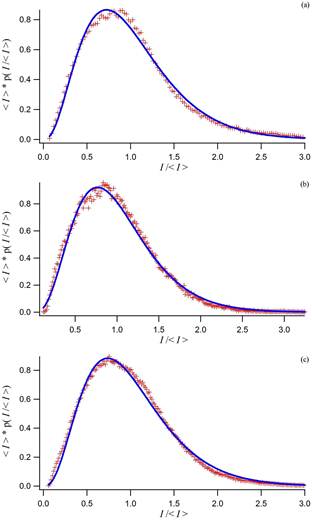
Figure: Gamma Function Fit. Fits to the Gamma |
Figure: Rician Function Fit. Fits to the Rician fun- |