Mode Mixed Image of a Complex Object
The image in the lower panel of
Figure: Physics Building Atrium GHz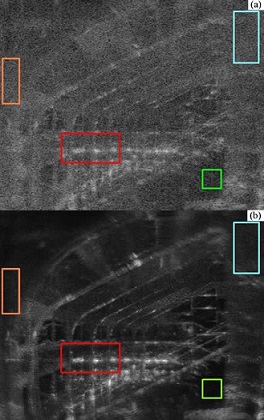
Image. (a)218.4 GHz image of the atrium
of the Physics Building at Ohio State Univer-
sity with multimode illumination, but without
modulated mode-mixing and (b)with modul-
ated mode mixing. The colored boxes show
areas for which speckle statistics have been
calculated.
This large number of statistically independent images (and the related large improvement in speckle contrast) is perhaps at first consideration surprising. Our mode mixer rotates at ~100 Hz and considering the two facets of its reflective surface produces a modulation frequency of ~200 Hz. Since our pixel dwell time is of ~10 msec, this is only about two modulation periods per pixel. To achieve the improvements in speckle contrast that we observed, the mode mixer must be illuminating many modes per revolution. The same three regions were also fit to the modified Rician density function, shown in Figure: Rician Function Fit Mode Mixed Image . In the limit of small contrast, or high $N$ and $r$, the gamma density function of Eq. 1 and the modified Rician density function of Eq. 2 are nearly indistinguishable; both distributions become Gaussian-like as the speckle contrast approaches 0. The orange box in the middle left returned $r = 98.8$, the green box in the lower middle $r = 315.6$, and the blue box in the upper right $r = 84.2$. The averaged speckle contrast value of the three sections of the picture was $C = 0.124$.

Figure: Gamma Function Fit Averaged Image. |

Figure: Rician Function Fit Mode Mixed Image. |