Methyl Cyanide
We will start with methyl cyanide to illustrate effects of optical thickness, rotational and vibrational temperatures, and isotope effects. In the comparisons the offset of ~ 1 Jy/beam between the simulation and the ALMA spectrum is due to the non-spectral line continuum of the Orion KL hot core region measured by ALMA. While we have normalized the intensity of the simulation to that of the spectral lines of the ALMA spectrum, we have left the offset because it facilitates comparison between the simulation and the ALMA spectrum. For other comparisons of weaker spectra shown below, this offset is reduced so as to minimize white space.
Figure Methyl Cyanide Ground Vibrational State. Spectral com-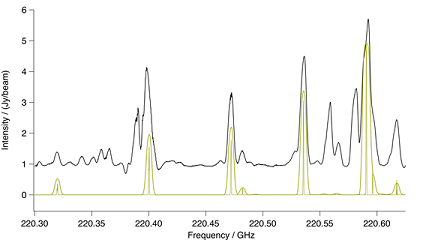
parison in the region of a methyl cyanide ground vibrational state ba-
ndhead. The upper black trace is ALMA and the lower gold trace a CES
LTE simulation at 190K, including effects of optical thickness. Also in
gold is a stick spectrum that shows methyl cyanide at laboratory res-
olution.
Methyl cyanide has a strong spectrum that in a number of places is relatively unobscured by overlapping
lines. A number of its lines are also optically thick. It was possible to match many strong features of
both the ground state and $v_8 = 1$ vibrational states in ALMA with an LTE simulation at 190 K.
Figure Methyl Cyanide Ground Vibrational State. Spectral com-
parison in the region of a methyl cyanide ground vibrational state ba-
ndhead. The upper black trace is ALMA and the lower gold trace a CES
LTE simulation at 190K, including effects of optical thickness. Also in
gold is a stick spectrum that shows methyl cyanide at laboratory res-
olution.
Figure: Methyl Cyanide v8=1. Spectral comparison in the region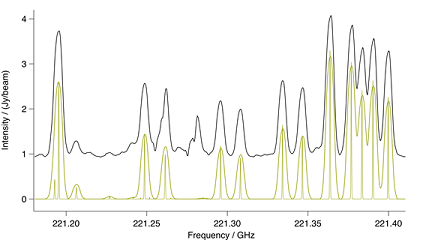
of a methyl cyanide $v_8 = 1$ bandhead. The upper black trace is ALMA
and the lower gold trace a CES LTE simulation at 190K, including eff-
ects of optical thickness. Also in gold is a stick spectrum that shows
methyl cyanide at laboratory resolution.
Although the lines in the $v_8 = 2$ vibrational state shown in
Figure: Methyl Cyanide n8=2. Spectral comparison in the region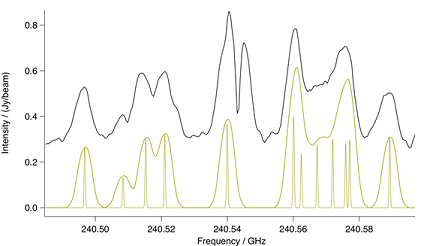
of a methyl cyanide $n_8 = 2$ bandhead. The upper black trace is ALMA
and the lower gold trace a CES LTE simulation at 190 K. Also in gold is
a stick spectrum that shows methyl cyanide at laboratory resolution.
Figure: Methyl Cyanide n8=2. Spectral comparison in the region
of a methyl cyanide $n_8 = 2$ bandhead. The upper black trace is ALMA
and the lower gold trace a CES LTE simulation at 190 K. Also in gold is
a stick spectrum that shows methyl cyanide at laboratory resolution.
It is well known that the interstellar isotopic abundances differ from the terrestrial abundances, but
that care needs to be taken to include the impact of optical thickness.
Figure: 13C Methyl Cyanide Ground Vibrational State. Spectral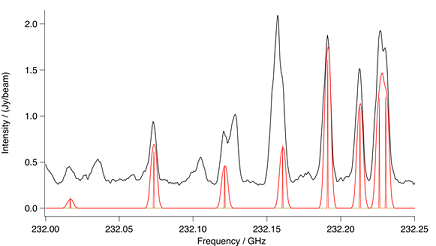
comparison in the region of a methyl cyanide ground vibrational state,
13C methyl group bandhead. The upper black trace is ALMA and the
lower red trace a CES LTE simulation at 190 K. Also in red is a stick sp-
ectrum that shows methyl cyanide at laboratory resolution. To account
for the differences in interstellar and terrestrial abundances, the intens-
ity of the simulation has been increased by a factor of 2.5.
More inclusively, the intensities of all of the lines simulated from the CES for methyl cyanide and that are not overlapped by interfering spectra are consistent with this simple model for the interpretation of the ALMA data. It will be interesting to see if deviations from this simple single temperature LTE model occur as both the ALMA and the spectroscopic analysis are refined and expanded to include more species simultaneously.
Figure: Methyl 13C Cyanide Ground Vibrational State. Spectral
comparison in the region of a methyl cyanide ground vibrational state,
13C cyanide group bandhead. The upper black trace is ALMA and the
solid lower red trace a CES LTE simulation at 190 K. Also in red is a st-
ick spectrum that shows methyl cyanide at laboratory resolution. The
dashed gold trace is from the 12C simulation of Figures 4 and 5. To
account for the differences in interstellar and terrestrial abundances,
the intensity of the 13C simulation has been increased by a factor of 2.5.