Electron Beam Sources
Although the emphasis for the last several decades has been on solid state source development, electron beam devices have played an important role in THz spectroscopy. In fact, as can be seen in Table III.D-1, Backward Wave Oscillators (BWOs) significantly exceed the broadband power producing capabilities of solid state sources shown in Figure: Available Solid State Power . Although beyond the scope of this article, it is probably worth noting that there is virtually no limit (other than economic) on the amount of power that can be produced in the THz region by e-beam sources. For example, a new Free Electron Laser (FEL) designed at UCSB to be driven by a 2 MeV electron beam would produce 1 kW cw at 300 GHz. As shown by Madey, FELs are formally equivalent to classical tubes. Arbitrarily high power at high frequency can be obtaining by raising the energy of the electron beam, especially into the relativistic regime where the 'size' limitations on THz sources are transcended by relativistic effects. While the limits on electron energy in solid state sources preclude such an approach, it is likely that a functionally equivalent solution will ultimately be obtained by the integration of large arrays of individually small solid state sources.
| OB-24 | OB-30 | OB-32 | OB-80 | OB-81 | OB-82 | OB-83 | OB-84 | OB-85 | |
|---|---|---|---|---|---|---|---|---|---|
| Operating Range (GHz) | 179-263 | 258-375 | 370-535 | 526-714 | 667-857 | 789-968 | 882-1111 | 1034-1250 | 1153-1500 |
| Power (min) mW | 1-10 | 1-10 | 1-5 | 1-5 | 1-5 | 1-3 | 1-3 | 0.5-2 | 0.5-2 |
For the region between about 100 and 1000 GHz, Backward Wave Oscillators (BWOs) [1].
Figure: Phase Locked THz Spectrometer. A
modern phase-locked THz spectrometer based on
BWO technology.
Figure: Phase Locked THz Spectrometer. A
modern phase-locked THz spectrometer based on
BWO technology.
Although under equilibrium conditions line-widths around 1 THz are ordinarily Doppler limited to ~ 1 MHz, the spectral purity and power of BWO sources make possible the use of saturation spectroscopy to significantly reduce this limit. In a particularly interesting demonstration Belov and his coworkers have observed ~ 0.05 MHz wide saturation features in the ammonia spectrum near 570 GHz [6]. Both the sensitivity and line-width of the system are dramatically illustrated in Figure: NH3 Observed Spectra which shows spectra for both 14NH3 and 15NH3 in natural abundance (0.366%).
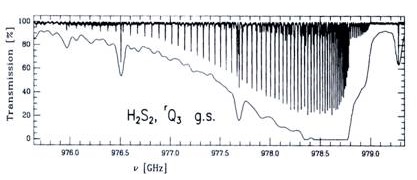
Figure: HSSH Ground State. Ground state rQ3 branch of
HSSH. |

Figure: NH3 Observed Spectra. Obs- |
Figure: The FASSST Spectrometer.
Finally, we will discuss in somewhat more detail a different approach to THz spectroscopy, the Fast Scan Submillimeter Spectroscopy Technique (FASSST) [7].
Figure: The FASSST Spectrometer.
Figure: Frequency Differences for a BWO. Small
scale variation in frequency-voltage characteristic (lower
trace) and frequency differences between adjacent dig-
itized points (upper trace) as a function of frequency
for a typical BWO.
The philosophy behind this system is based on the fact that, like most e-beam based microwave oscillators, the source line-width (short-term stability) of the BWO oscillator is much less than the Doppler width of a spectral line. Thus, the phase-lock approach discussed above is needed not to improve this spectral purity, but rather to stabilize against thermal and power supply induced long term (≥ 0.01 sec) drift and ripple. It is straightforward to show that a combination of power supply development and a fast frequency scan can 'freeze' these instabilities, so long as a frequency reference can be provided which will allow the BWO's frequency instability to be calibrated in software [7]. The size of the FP cavity is dictated by the need to interpolate between adjacent FP cavity modes and the details of the small scale structure of the frequency-voltage characteristic of the BWO. Figure: Frequency Differences for a BWO shows a typical example. These fluctuations are caused by standing wave phenomena both within and external to the tube. The key system elements include:
- The most fundamental element of the FASSST system is the excellent short term spectral purity of the BWO. From studies over many years, it has been observed that the short-term spectral purity of free running ISTOK BWOs is <20 kHz. Without this spectral purity, the FASSST system would not be possible.
- Secondly, the BWOs can be voltage tuned continuously over an ~50% frequency range, which contains ~105 spectral resolution elements (Doppler limited).
- The synthesized frequency reference system typical of high resolution submillimeter spectrometers is replaced by a system more typical of optical spectroscopy. However, the longer wavelength significantly relaxes the requirements for optical precision and much greater frequency accuracy can be achieved.
- A fast (~105 spectral resolution elements/sec, currently limited by detector bandwidth) sweep and data acquisition system 'freeze' any drift in the source frequency over the time required to sweep from one reference fringe to the next. This eliminates the need for active frequency stabilization.
- Fast data acquisition and calibration hardware and software. In a very general sense, the bandwidth of this system plays the same role as the bandwidth of the lock loops of more traditional systems.
The combination of these five elements make it possible to measure thousands of spectral lines per second, with a frequency accuracy of a small fraction of a Doppler width (<0.1 MHz/3 x 10-6 cm-1). Signal averaging is straightforward, and for equivalent integration times the sensitivity is the same as for slow-sweep, synthesized phase locked systems. Finally, the system is very simple in both concept and execution.
There is a continuing realization that at the high frequency – high power frontier, vacuum electron beam devices will dominate. An active community has made considerable progress. In addition to ever improving microfabrication and magnet design capabilities, this progress has been enabled by much improved modeling tools for the complex large field interaction problem presented by efficient SMM/THz tubes. Applications such as plasma heating for fusion and radar have driven the development of gyrotrons, first in the Soviet Union [9] and more recently at Maryland and the Naval Research Laboratory [10]. A particularly interesting recent development is the progress toward the goal of a high power (tens of watts) broad band (tens of GHz) TWT amplifier in DARPA’s HiFIVE program [11].a class="hasTooltip" href="#ref13">[13]. These tubes have the potential to be real game changers in areas such as imaging, remote sensing, and communications in the SMM/THz. A review of high power vacuum electronic sources has recently been published [14].
References
- Backward-Wave Tubes Proc. IRE 41, 1602-1611 (1953). Google Scholar
- Wide-Range Oscillators for the Submillimeter Wavelengths Prib. Tekh. Eksp. 3, 231-237 (1969). Google Scholar
- Molecular Spectroscopy: Modern Research () II, 93-126 (Academic Press, 1976).
- Precision Broadband Spectroscopy in the Terahertz Region J. Mol. Spectrosc. 165, 294-300 (1994). Google Scholar
- Spectroscopy in the terahertz region Vib. Spectrosc. 8, 241-253 (1995). Google Scholar
- Sub-Doppler Spectroscopy of Ammonia Near 570 GHz Z. Naturforsch., A: Phys. Sci. 50, 1187-1190 (1995). Google Scholar
- A Fast Scan Submillimeter Spectroscopic Technique Rev. Sci. Instrum. 68, 1675-1683 (1997). Google Scholar
- FASSST: A new Gas-Phase Analytical Tool Anal. Chem. 70, 719A-727A (1998). Google Scholar
- Terahertz vacuum electronic circuits fabricated by UV lithographic molding and deep reactive ion etching Appl. Phys. Lett. 95, 181505-1,3 (2009). Google Scholar
- Permanent Magnet for HiFIVE Sheet Beam Transport Vacuum Electronics Conference (IVEC) 451-452 (2010). doi:10.1109/IVELEC.2010.5503452 Google Scholar