A Line List Catalog
Figure: Overlapped Lines.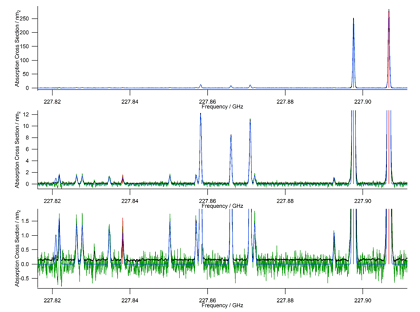
In the first approach, after a peak finder locates the individual lines, they are fit to Gaussian lineshape functions, producing a line list of frequencies, line strengths, and line widths. In congested areas multiple Gaussians are fit simultaneously. Software then collects the information for each of the ~1000 - 10000 lines and performs a LSQ fit as a function of the ~400 - 1200 temperature scans to determine $S_{ij}m^2$ and $E_l$ for each of the lines, both assigned and unassigned. This produces the usual astrophysical catalog data. Because of the possibility of blends, this software also provides figures of merit to inform the user of spectral features whose origins may be from more than a single transition. As we have previously noted, these blends are a problem not only for this approach, but also for the usual QM catalog approach because a number of cataloged lines are overlapped by significantly stronger lines that are not included in the catalogs. An example of this is shown in Figure: Overlapped Lines .