The Character of Rotational Spectra
For the most general case of an asymmetric rotor, none of the $I_j$ are equal and the quantized
rotational energy levels become
\begin{equation}E=\frac{1}{2}\left(B+C\right)J\left(J+1\right)+\left[A-\frac{1}{2}\left(B+C\right)\right]W_{J_{\tau}}(b_p)
\label{eq:asym_eng}\end{equation} where $A$, $B$, and $C$ are constants inversely proportional to the
$I_j$'s, and $W_{J_{\tau}}(b_p)$ is a complicated function related to the degree of asymmetry of the
molecule and angular momentum projection quantum numbers [1].
However, in the prolate symmetric top limit $B=C$ $W_{J_{\tau}}(b_p) = K^2$ and it is possible to use
this relation along with the dipole selection rule $J \rightarrow J+1, \Delta K = 0$ to illustrate the
general character of rotational spectra. Figure: Rotational Interaction Strength. Rotational interaction
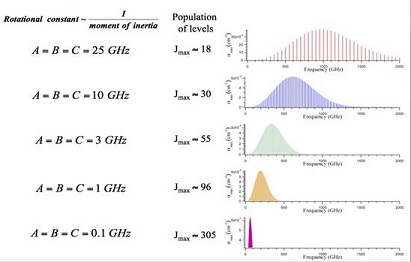
strength in the THz spectral region as a function of molecular size (i.e.
the molecular moments of inertia) and frequency.
Figure: Rotational Interaction Strength
above plots the absorption coefficients at 300 K for the $K=0$ component of each $J \rightarrow J+1$
transition for symmetric tops of various $B$ values. For rigid symmetric tops, the $K \neq 0$ components
are degenerate with the $K=0$ transitions, but for real molecules are slightly (a few MHz) displaced due
to centrifugal distortion effects. In this symmetric top limit, it is straightforward to show that the
values of $J$ and $\nu$ for which rotational lines are strongest are given by \begin{equation}J_\text{opt}
\approx 5(T/B)^{1/2}\end{equation} \begin{equation}\nu_\text{opt} \approx 2B+11(BT)^{1/2}\end{equation}
where $T$ is the temperature in Kelvin and $B$ a rotational constant in GHz.
Figure: HCOOCH3 and HNO3. Excited vibra-
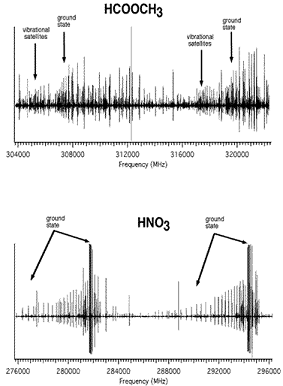
tional states in HCOOCH3 and HNO3.
For asymmetric tops the $K \neq 0$ components are more widely spread according to their asymmetry and Equation 1, but on average have similar transition strengths. Additionally, because of the lower symmetry of asymmetric rotors, components of the dipole moment can exist along each of the three axes and a new set of selection rules and spectra will appear for each. Although this can lead to a spectrum of great complexity, the character of the symmetric tops is representative of the average spectral density, distribution in frequency, and strength of lines. Although the complete spectral assignment of asymmetric rotors can be a complex task, from many perspectives it is unnecessary because either a reference spectrum can be recorded and archived or any of several spectral catalogues can be consulted [2].a class="hasTooltip" href="#ref3">[3].
Figure: Rotational Interaction Strength also shows that as $B$ decreases, there are more thermally populated transitions, and that the lines are more closely spaced and weaker. Calculations show that the average spacing of rotational lines becomes equal to the Doppler width for molecules whose rotational constants are ~ 0.1 GHz. For molecules whose atoms have masses similar to those of HNO3, the rotational constants are ~ 0.1 GHz for molecules of mass ~1000 AMU.
Figure: HCOOCH3 and HNO3 also illustrates another important feature of rotational spectra in the THz region: the contributions from pure rotational transitions in excited vibrational states. Because methyl formate (HCOOCH3) has larger rotational constants ($A$, $B$, $C$) than nitric acid (HNO3), it has a sparser pure rotational spectrum. However, because it has low lying ($\lt kT$) torsional and vibrational states, many of these contribute spectra of intensity similar to that of the ground state and contribute to the much denser spectrum shown in the figure. It is likely that molecules of ~1000 AMU will have many low lying, thermally populated states, thereby leading to a more congested spectrum than in the simple estimate above. On the other hand, molecules of ~1000 AMU made of heavier atoms than HNO3 will have larger rotational constants and less dense spectra. This large molecule limit is an interesting and as yet unexplored topic in rotational spectroscopy, which will ultimately place the limit on the mass and size of molecules that have highly specific rotational signatures.
References
- Microwave Molecular Spectra Techniques of Chemistry 18, 929 (John Wiley & Sons, 1984). Google Scholar
- Submillimeter, Millimeter, and Microwave Spectral Line Catalog J. Quant. Spectrosc. Radiat. Transfer 60, 883-890 (1998). Google Scholar