Speckle Contrast
In
Figure: Concealed Knife. (a) Image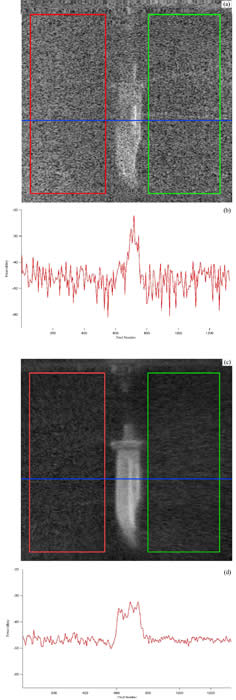
of a knife under a thin brown robe at 632
GHz. (c) Co-added image of a knife taken
at 16 independent angles. The quantitat-
ive traces below each image show the sig-
nal along the blue line in each image. Th-
ese graphs show that the speckle contrast
noise is reduced by (16)1/2=4 by the ave-
raging over the 16 independent images.
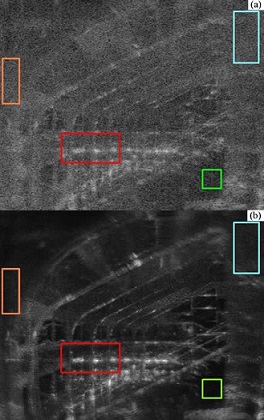
Figure: Physics Building Atrium GHz |
Figure: Concealed Knife. (a) Image |