Rotation - Vibration Spectra
Although rotational spectra are unique to molecules, molecules also have spectra associated with their electronic, vibrational, and nuclear degrees of freedom. It is fortuitous that for most species the characteristic energies associated with each of these is separated from its neighbor by perhaps two orders of magnitude. Quantum mechanically, this allows the molecular wave function to be separated into parts and each solved separately in the context of an effective Hamiltonian. Classically, a similar picture evolves with the much higher speed of the more energetic motions providing average potentials for their less energetic neighbor. In both pictures, the rapid electronic motion provides an average electrostatic potential in which the nuclei vibrate, the average positions of the vibrating nuclei provide the moments of rotational inertia, etc.
This large separation in energy also leads to a relation between each degree of freedom and a portion of the electromagnetic spectrum: The electronic and the optical, the vibrational and the infrared, the rotational and the microwave, and the nuclear hyperfine interactions and the radio. As a result rather independent communities grew up around each of these combinations. However, while still rather distinct communities, the rotational (microwave) and vibrational (infrared) are being brought together by technological advances. In the early days, the resolution of infrared spectrometers was too low to resolve the rotational structure of any except the lightest (e.g. H2O) species and microwave techniques did not have the frequency coverage to measure significant rotational spectra except in much heavier molecules. However, now FTIR and laser techniques can resolve the Doppler limit (~100 MHz) and THz technologies have very wide spectral coverage.
Figure: HNO3 Absorption Spectrum. Spectrum of HNO3
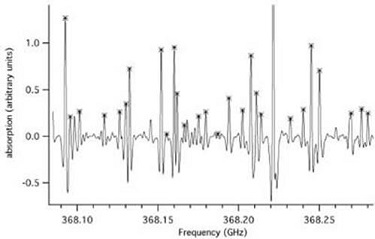
which shows the absorptions in the excited ν5 vibrations states
marked with crosses.
As a result, it is now common for "infrared" analyses to contain measured microwave data in large weighted least-squares analyses. Nitric acid provides a useful specific example. For this species infrared techniques have been used to study the rotational structure of all of its fundamental vibrations. THz techniques have now been used to study not only the molecules which reside in the ground vibrational state, but also the rotational structure of molecules in many of the excited vibrational states. While the thermal population in the excited states is reduced by the Boltzmann factor (e. g. the ν5 vibrational state lies at ~900 cm-1 and has a thermal population of ~1%), the resolution and sensitivity of THz spectroscopy makes the study of these small populations reasonably straightforward. For example, Figure: HNO3 Absorption Spectrum shows THz spectra of a number of these transitions which were recorded with a FASSST spectrometer with ~10-6 sec of integration time. For molecules such as HNO3 for which it is possible to record THz spectra over a large portion of its thermally populated rotational spectra, weighted infrared - THz fits are completely dominated by the higher accuracy THz data (the weighting ratio is typically 106). In fact, it has been shown that an analysis of the THz data can predict (except for the central vibrational frequency itself!), the entire infrared spectra to unprecedented accuracy. While this is useful for species such as HNO3 (especially in highly congested and perturbed regions of its spectrum), its real promise lies in somewhat heavier species (e. g. ClONO2) whose spectra are unresolved or marginally resolved in the Doppler limit in the infrared. The detailed ro-vibration structure of these species is of considerable interest for the recovery of atmospheric remote sensing information. This requires accurate modeling of the pressure and temperature variation of the recovered profiles. These can only be obtained by a detailed line model, which can be synthesized from analyses of the THz rotational structure in both the ground and upper vibrational state of the infrared band of interest.