The Physics and Spectroscopy of the SMM/THz
Figure: 20 Gas Mixture. 50 GHz of a spectrum of a mixture of 20 gases on a highly
com-
pressed scale taken with a FASSST BWO based system (top). 0.4% of this spectrum is exp-
anded to show individual lines (bottom). Comparison with the library spectra of eight
gases
shows their presence in the gas mixture (middle).
To illustrate the rotational fingerprint,
Figure: 20 Gas Mixture. 50 GHz of a spectrum of a mixture of 20 gases on a highly
com-
pressed scale taken with a FASSST BWO based system (top). 0.4% of this spectrum is
exp-
anded to show individual lines (bottom). Comparison with the library spectra of eight
gases
shows their presence in the gas mixture (middle).
Figure: 14 Gas Mixture. The spectrum of a mixture of 14 gases in the region 210 -270
GHz on a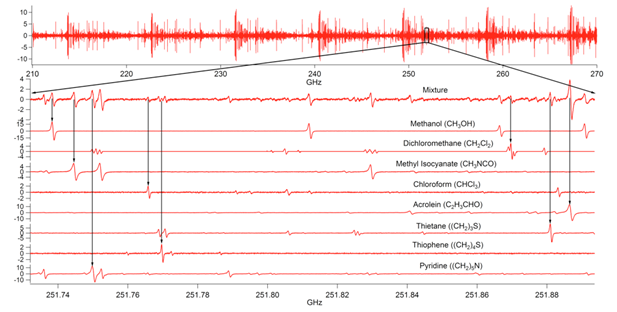
compressed scale (upper panel). The spectrum of a 0.15 GHz segment of this mixture (second
panel).
The library spectra of 8 of these gases (panels three through 10).
References
- Submillimeter Spectroscopy for Chemical Analysis with Absolute Specificity. Opt. Lett. 35, 1533-1535 (2010).